A TiDB Success Story
Recently, I found myself helping out an internal team with a TiDB performance issue.
Pretty quickly it looked like the root cause was a sudden query plan change. This is a common issue with SQL databases because SQL is declarative. It is up to the optimizer to select the best query plan. Sometimes it will change over time, or even select different query plans for what seems like the same query.
What was different this time, was I didn't just suspect the query plan had changed, I could prove it:
- TiDB and MySQL have available statement digests, which normalizes statements to their prepared statement form.
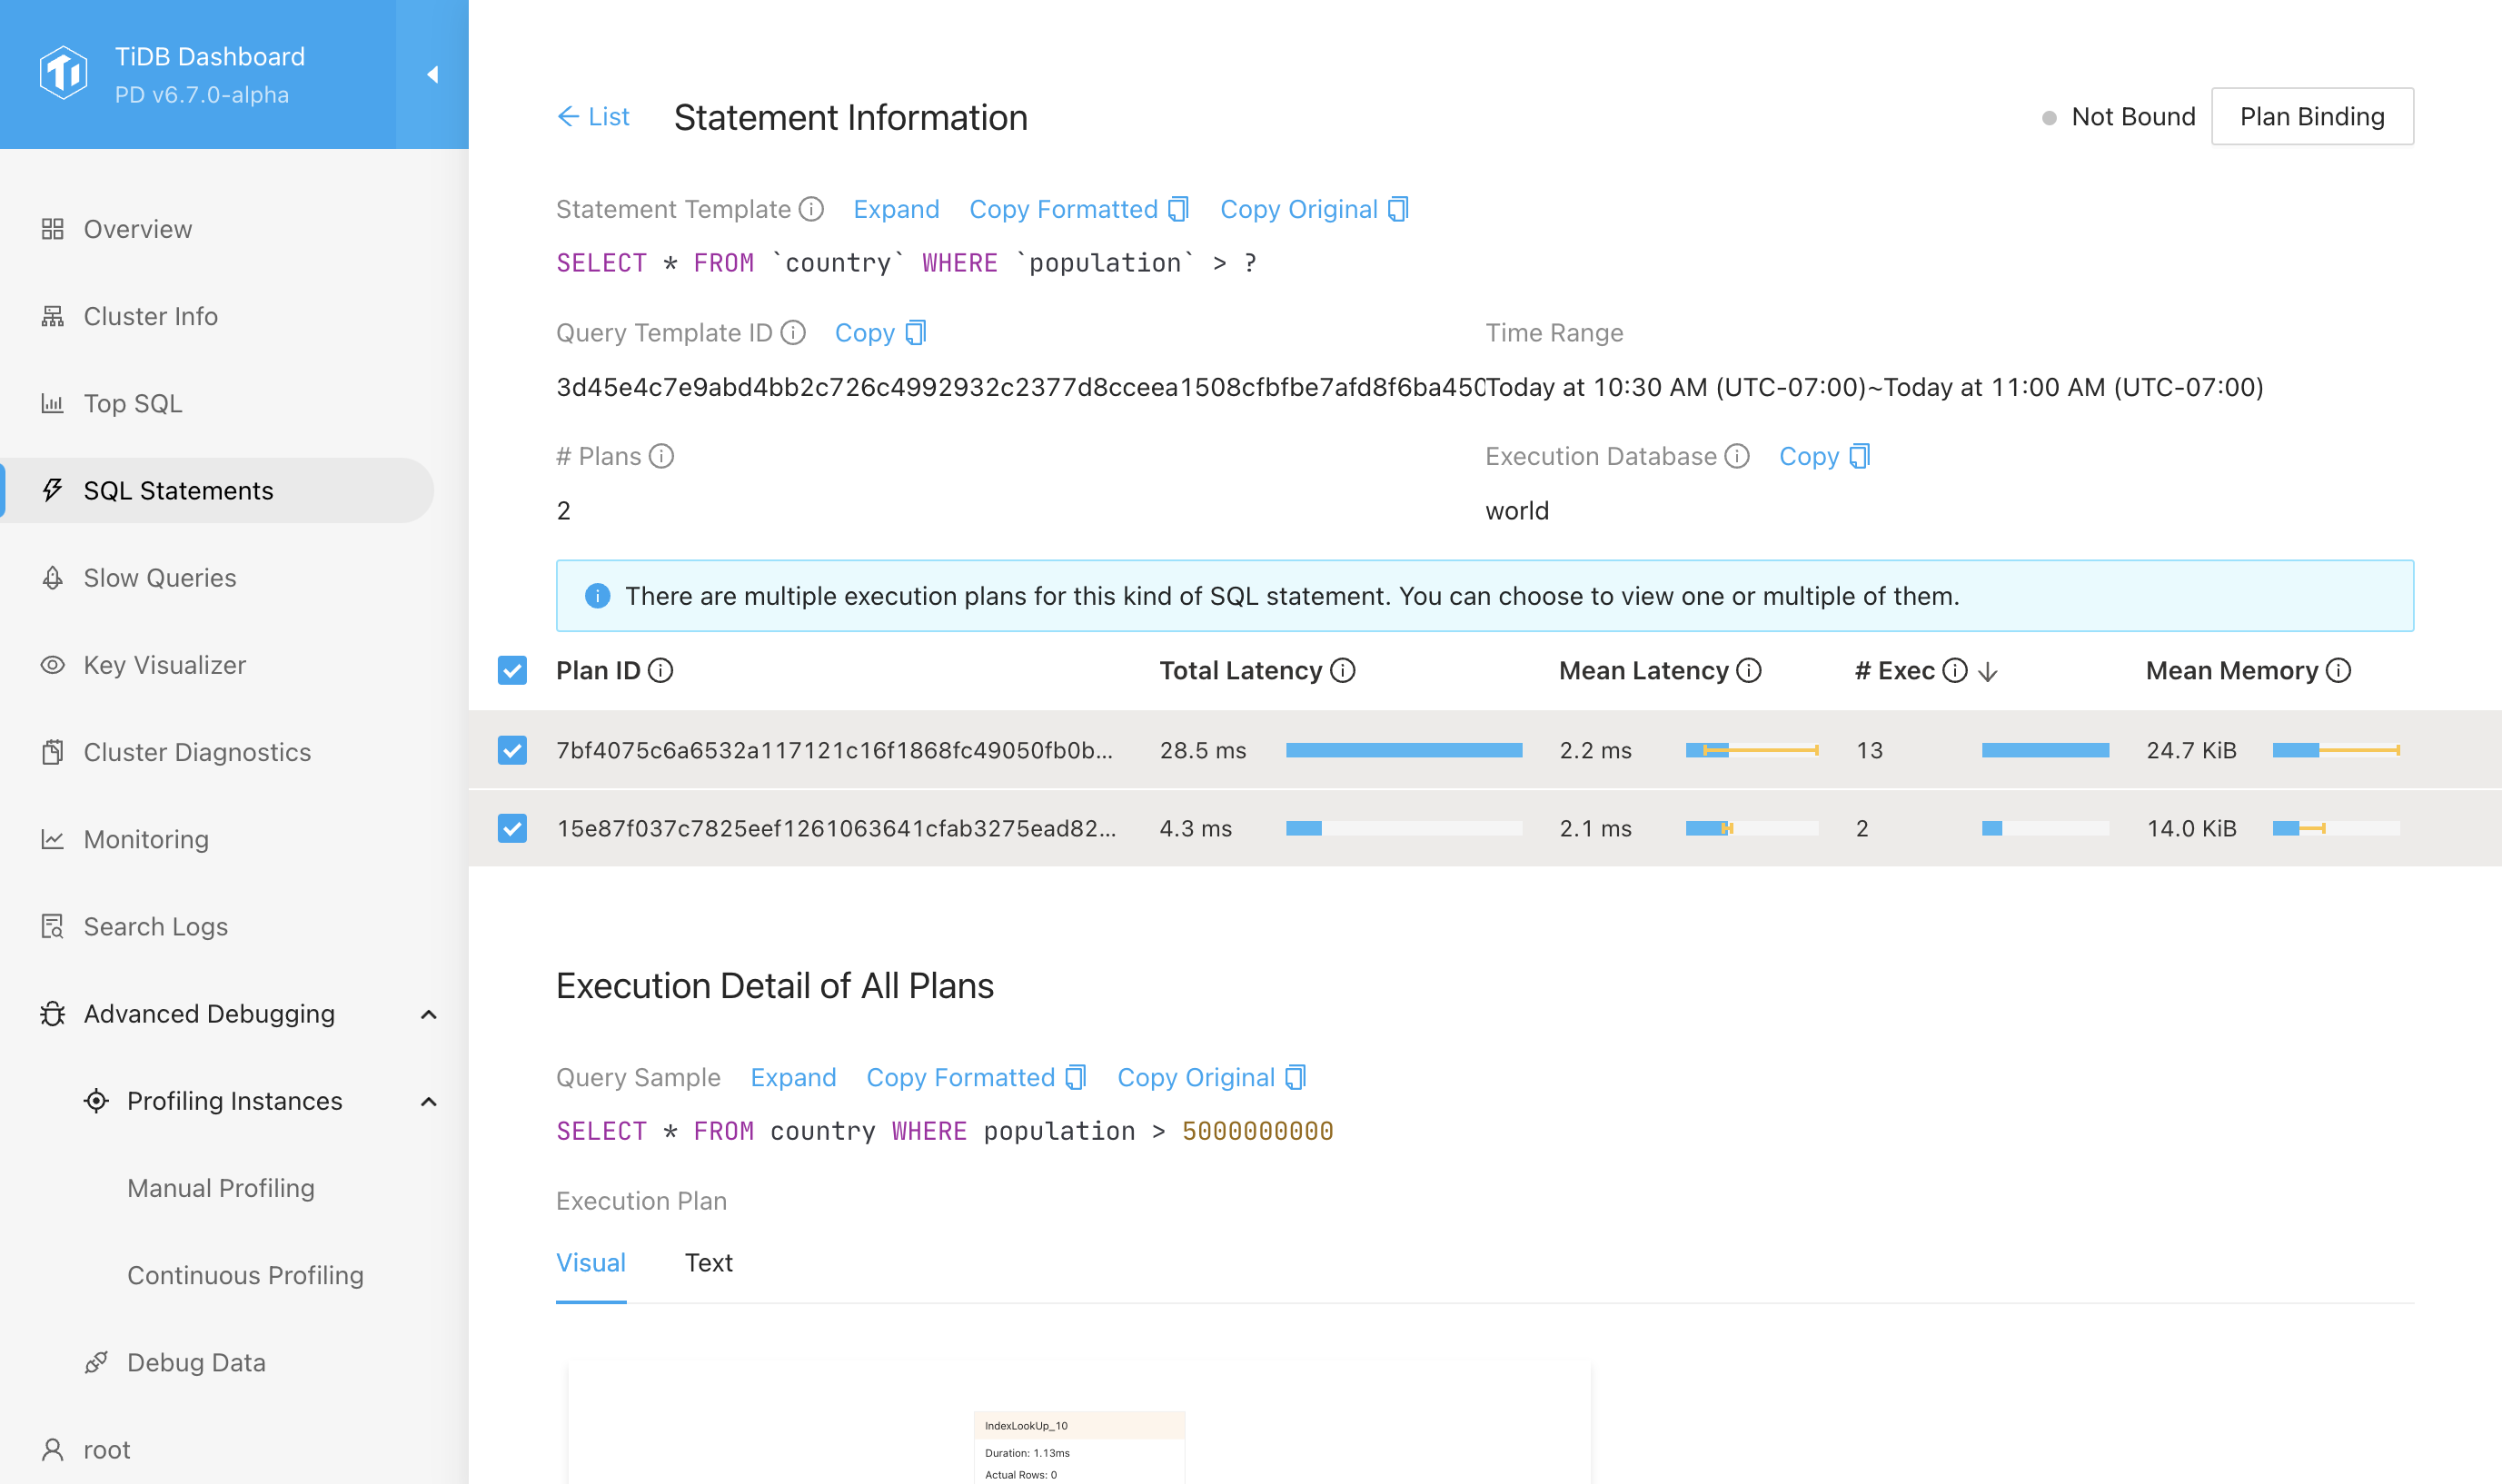
- But TiDB takes this a step further by offering plan digests. This captures the basic set of operators to execute a query. If in one query it uses an index, and another it requires a table scan, this will be reflected by two different plan digests for the same statement digest.
You can see the different plan digests directly in the TiDB Dashboard:

Or as I usually prefer, with information_schema:
mysql> SELECT plan_digest, count(*), avg(query_time)
FROM information_schema.slow_query
WHERE digest='3d45e4c7e9abd4bb2c726c4992932c2377d8cceea1508cfbfbe7afd8f6ba4508'
GROUP BY Plan_digest;
+------------------------------------------------------------------+----------+-----------------------+
| plan_digest                                                      | count(*) | avg(query_time)       |
+------------------------------------------------------------------+----------+-----------------------+
| 15e87f037c7825eef1261063641cfab3275ead82c0245867b2ada898630904ab |        2 |          0.0019361875 |
| 7bf4075c6a6532a117121c16f1868fc49050fb0b1aae84ecd7ca624ab7dd9275 |        5 | 0.0030571670000000004 |
+------------------------------------------------------------------+----------+-----------------------+
2 rows in set (0.05 sec)
From here you can then get samples of the query for each plan. In this example, I have an index on Population, but it is only used in the first query. This can easily be verified in EXPLAIN (not shown):
mysql> SELECT Query FROM information_schema.slow_query
WHERE plan_digest='15e87f037c7825eef1261063641cfab3275ead82c0245867b2ada898630904ab'
LIMIT 1;
+------------------------------------------------------+
| Query                                                |
+------------------------------------------------------+
| SELECT * FROM country where population > 5000000000; |
+------------------------------------------------------+
1 row in set (0.05 sec)

mysql> SELECT Query FROM information_schema.slow_query
WHERE plan_digest='7bf4075c6a6532a117121c16f1868fc49050fb0b1aae84ecd7ca624ab7dd9275'
LIMIT 1;
+-----------------------------------------------------+
| Query                                               |
+-----------------------------------------------------+
| SELECT * FROM country where population > 500000000; |
+-----------------------------------------------------+
1 row in set (0.00 sec)
Conclusion
Once you can see the plan has indeed changed, you can then spend your time determining the next action. It could be a different index, optimizer hint, or it might be something different about the parameters that makes the statement illogical and return too much data.
Good observability features make debugging easier, and reduce the time to resolution. Generally speaking, I think MySQL has gotten really good at observability. But in this case, TiDB has one up on it!